Running your tests with multiple threads does not work. Bugs depend on a specific thread interleaving, which is often impossible to reach by simply rerunning your test multiple times. And data races only occur on specific hardware architectures and JVMs.
Therefore vmlens uses the Java Memory Model to execute all possible thread interleavings and to check for data races in the program flow. This blog post describes how vmlens uses the Java Memory Model to test all thread interleavings.
The following example shows how to write multi-threaded tests with vmlens. All examples are in this GitHub project:
import com.vmlens.api.AllInterleavings;
public class TestUpdateWrong {
    public void update(ConcurrentHashMap<Integer, Integer> map) {
        Integer result = map.get(1);
        if (result == null) {
            map.put(1, 1);
        } else {
            map.put(1, result + 1);
        }
    }
    @Test
    public void testUpdate() throws InterruptedException {
        try (AllInterleavings allInterleavings =
                new AllInterleavings("TestUpdateWrong");) {
	// surround the test with a while loop, iterationg over
	// the class AllInterleavings
            while (allInterleavings.hasNext()) {
                final ConcurrentHashMap<Integer, Integer> map =
                        new ConcurrentHashMap<Integer, Integer>();
                Thread first = new Thread(() -> {
                    update(map);
                });
                Thread second = new Thread(() -> {
                    update(map);
                });
                first.start();
                second.start();
                first.join();
                second.join();
                assertEquals(2,map.get(1).intValue());
            }
        }
    }
}
In your test method, you surround the code you want to test with a while loop iterating over the class AllInterleavings. vmlens executes the block inside the while loop multiple times, for each thread interleaving once. If the test fails vmlens shows the thread interleaving which led to the failure. If the test succeeds vmlens shows the last thread interleaving.
The above example test fails, and vmlens reports the interleaving which led to the failed assertion:
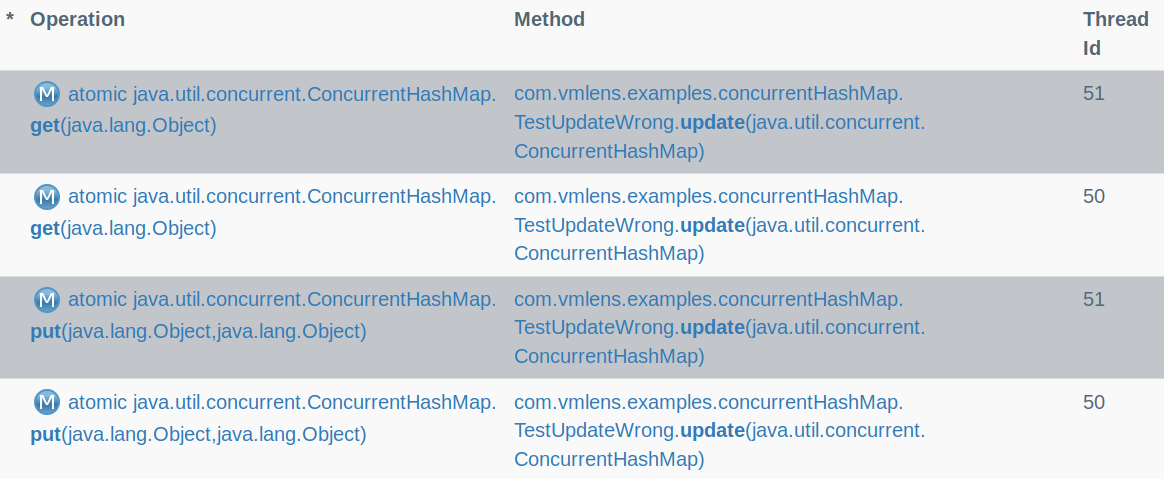
In maven, you can see this report by clicking on the link TestUpdateWrong in the file target/interleave/elements.html. In eclipse you can see the report by clicking on the link TestUpdateWrong in the view under Window -> Show View -> Other... -> vmlens -> vmlens Explorer.
The maven reports are described here. The eclipse views are described here.
You can run the test in eclipse using the vmlens run short cut for JUnit. Right click on the JUnit class -> Run As -> JUnit Test traced with vmlens.
To run the test with maven put the vmlens interleave plugin in your maven pom.xml as described here.
vmlens analyses a trace of the test run to detect data races and deadlocks. A data race happens when reading and writing to a shared variable is not correctly synchronized. A data race means that thread might read stale or inconsistent values.
The following example shows a data race in an inconsistent synchronized test.
public class TestInconsistentSynchronized {
	private static final Object LOCK_1 = new Object();
	private static final Object LOCK_2 = new Object();
	int i = 0;
	@Test
	public void test() throws InterruptedException {
		try (AllInterleavings allInterleavings =
				new AllInterleavings
				("TestInconsistentSynchronized");) {
			while (allInterleavings.hasNext()) {
				Thread first = new Thread(() -> {
					synchronized (LOCK_1) {
						i++;
					}
				});
				Thread second = new Thread(() -> {
					synchronized (LOCK_2) {
						i++;
					}
				});
				first.start();
				second.start();

				first.join();
				second.join();
			}
		}
	}
}
For the above test, vmlens reports the interleaving which led to the data race:
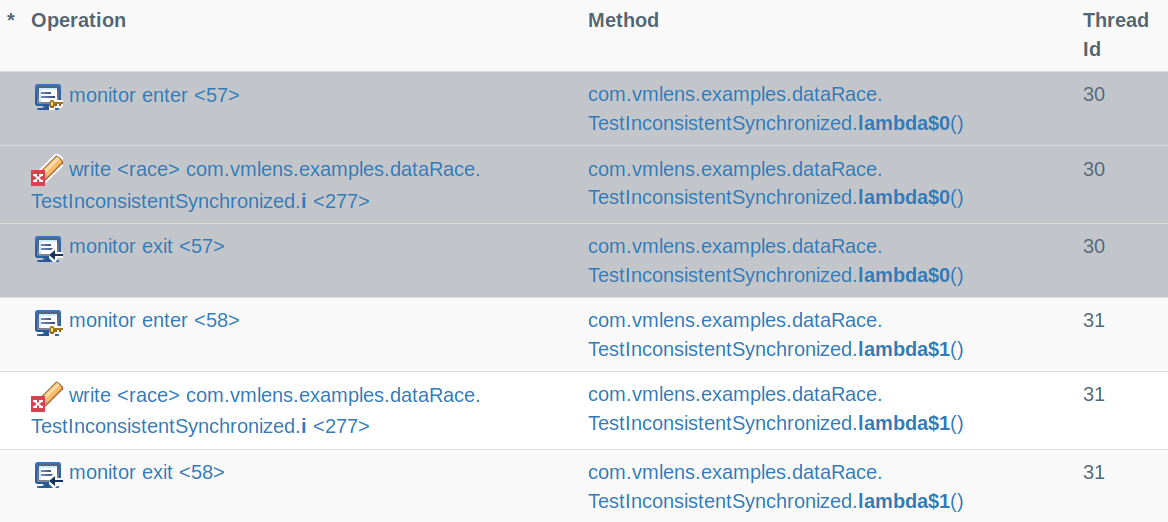
In maven, you can see this report by clicking on the link TestInconsistentSynchronized in the file target/interleave/elements.html. In eclipse you can see the report by clicking on the link TestInconsistentSynchronized in the view under Window -> Show View -> Other... -> vmlens -> vmlens Explorer.
The maven reports are described here. The eclipse views are described here.
To detect a deadlock during a test run both threads need to request the locks at the exact same time. To make deadlock detection timing independent, vmlens analysis the order in which the threads request the locks. If this order contains a cycle vmlens has found a deadlock.
public class TestUpdateRecursive {
	private final ConcurrentHashMap<Integer, Integer>
		map = new ConcurrentHashMap<Integer, Integer>();
	public TestUpdateRecursive() {
		map.put(1, 1);
		map.put(2, 2);
	}
	public void update12() {
		map.compute(1, (key, value) -> {
			map.compute(2, (k, v) -> {
				return 2;
			});
			return 2;
		});
	}
	public void update21() {
		map.compute(2, (key, value) -> {
			map.compute(1, (k, v) -> {
				return 2;
			});
			return 2;
		});
	}
	@Test
	public void testUpdate() throws InterruptedException {
		try (AllInterleavings allInterleavings =
				 new AllInterleavings("TestUpdateRecursive");) {
			while (allInterleavings.hasNext()) {
				Thread first = new Thread(() -> {
					update12();
				});
				Thread second = new Thread(() -> {
					update21();
				});
				first.start();
				first.join();

				second.start();
				second.join();
			}
		}
	}
}
For the above test vmlens generates the following report:
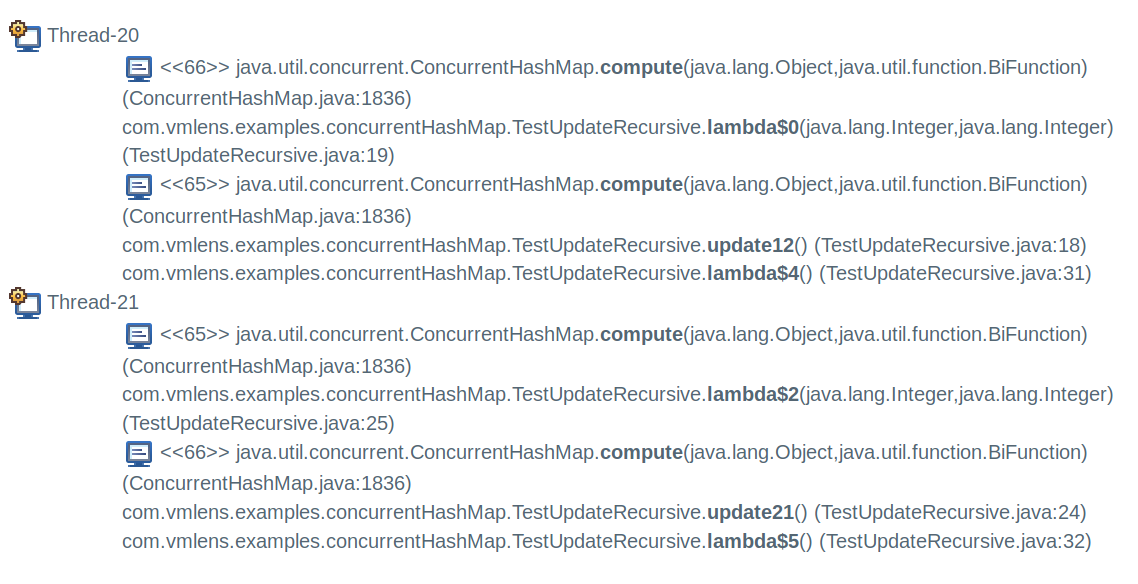
In maven, you can see this report by opening the file target/interleave/issues.html. In eclipse you can see the report by opening the view under Window -> Show View -> Other... -> vmlens -> vmlens Issues.
The maven reports are described here. The eclipse views are described here.
When writing multi-threaded tests using vmlens you should follow the following tips:
To use vmlens with maven, configure a plugin tag to tell maven that the vmlens plugin should be executed at the test phase. And include the jar com.vmlens.api as test dependency.
<project>
<!-- to include the class AllInterleavings into the test class path.  -->
<dependency>
  <groupId>com.vmlens</groupId>
  <artifactId>api</artifactId>
  <version>1.1.5</version>
  <scope>test</scope>
</dependency>

<build>
  <plugins>
<!-- to run the vmlens maven plugin during the maven test phase  -->
    <plugin>
    <groupId>com.vmlens</groupId>
    <artifactId>interleave</artifactId>
    <version>1.1.5</version>
    <executions>
      <execution>
        <goals>
          <goal>test</goal>
        </goals>
      </execution>
    </executions>
    </plugin>
     ...
    </plugins>
</build>
      ...
</project>
The vmlens interleave plugin is based on the maven surefire plugin. All configs which apply to the maven surefire plugin apply also to the interleave plugin, except the test fork configs.
The following parameters are additions from the vmlens interleave plugin:
The doNotTrace let you exclude methods from tracing through vmlens. A method matching the doNotTrace tag and all methods called by this method will not be traced by vmlens. In the following example the method om. and all methods of the class com. will not be traced:
<doNotTrace>
	<method>com.vmlens.test.TestMethod.signal</method>
	<method>com.vmlens.test.TestMavenDoNotTrace.*</method>
</doNotTrace>
vmlens supports the ant directory pattern for method names. So you can use the following wild cards:
Examples:
The suppress tag let you suppress data races. If a data race is suppressed it will no longer show in the issue report and the build will no longer fail because of this data race. The following example shows how to suppress a data race at the field com., at the primitive array int[] in the method com. and at the array java.lang.String[] in the class com. using the pattern *.
<suppress>
 <race>com.vmlens.examples.config.TestSuppressDataRaceAtField.i</race>
 <race>int[]@com.vmlens.examples.config.TestSuppressPrimitiveArrayWithAt.updateArray</race>
 <race>java.lang.String[]@com.vmlens.examples.config.TestSuppressArrayWithAtAndPattern.*</race>
</suppress>
Trace let you narrow the methods which get traced. If trace is configured vmlens will only search for data races inside methods matching the trace elements. Also when showing the stack trace where the data race was found vmlens will start at the first method matching a trace element.
The following example shows how to narrow the search and stack trace to methods from classes to the package com.vmlens.test.
<trace>
	<method>com.vmlens.test.state.report.**</method>
</trace>
vmlens supports the ant directory pattern for method names. So you can use the following wild cards:
Examples:
The maven tag deadlockAndDataRaceDetection let you disable the offline detection of deadlocks and data races. To disable deadlock and data raqces set deadlockAndDataRaceDetection to false:
<deadlockAndDataRaceDetection>false</deadlockAndDataRaceDetection>
The issues report shows you all the issues found by vmlens. vmlens detects data races and deadlock by analyzing the execution trace of your test. The report is located in the file maven output folder target/interleave/issues.html.

The example report shows one data race, the symbol  and one deadlock, the symbol
  . The data races happened at accessing the field example.TestDataRace.i .The deadlock happened between the method lockOneToLockTwo and lockTwoToLockOne. Click one of the links to see the stack traces of the data race or deadlock.
After clicking on the data race you see the following report:
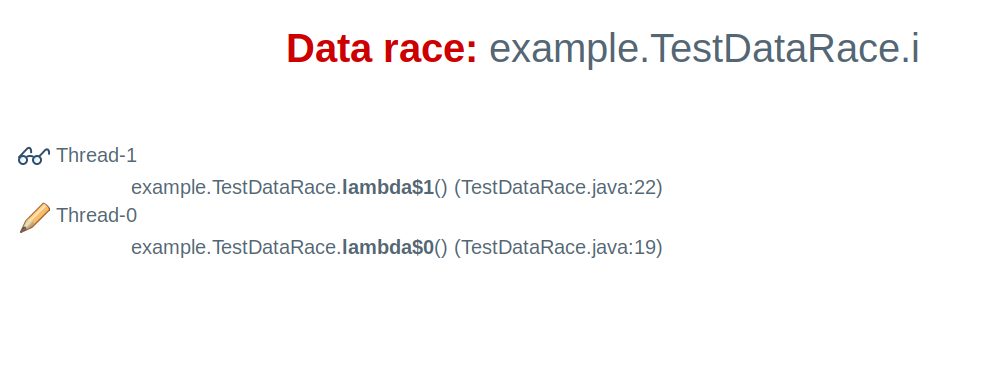
This Html site shows you the stack trace and thread name of the reading thread, the symbol  and for the writing thread, the symbol
  .
.
After clicking on the deadlock you see the following report:

This report shows you the thread names of the two threads in the deadlock, the symbol  ,and the stack trace. The position in the stack trace in which a monitor was acquired is marked with the symbol
  .
.
The interleave report shows you the thread interleavings which led to an assertion error or to a data race. The report is located in the file maven output folder target/interleave/elements.html.
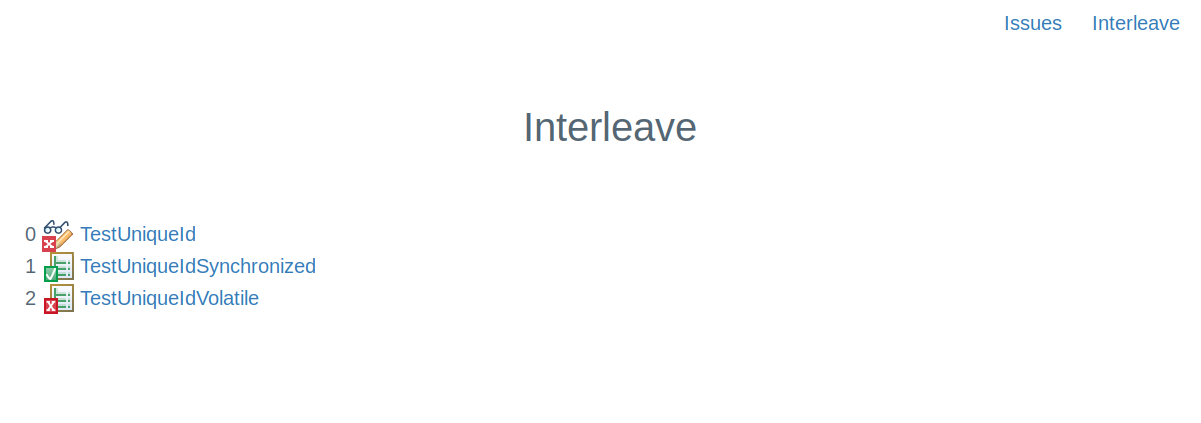
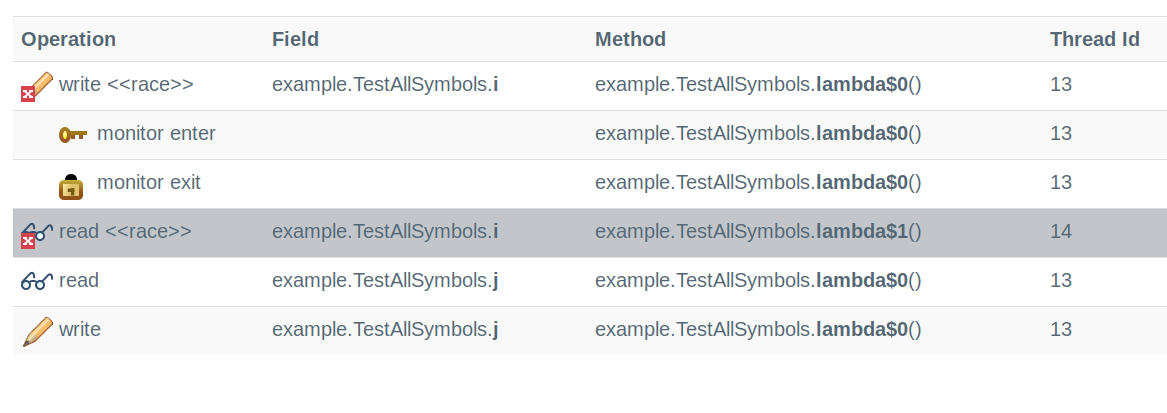
The interleave detail report shows you one thread interleaving of an interleave loop. The report shows you all synchronization actions and data races in the order of occurrence. In the above example, first, a thread with thread id 13 wrote to the variable i which led to data race. After that, the same thread entered a synchronized block, and so on. The following symbols are used in this report:
The following symbols are used in this report:
 A write which led to a data race
 A read which led to a data race
 A write to a volatile field
 A read to a volatile field
 A monitor or lock enter
 A monitor or lock exit
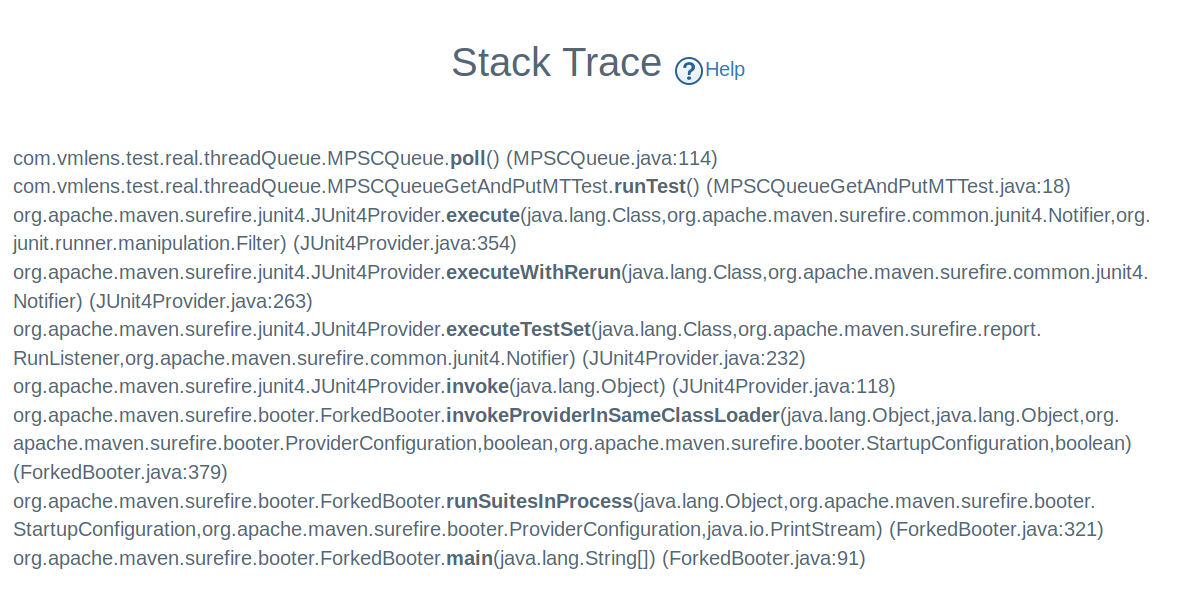
The stack trace report shows the stack trace of a method call:
To use vmlens with gradle, include it as plugin in build.. And include the jar com.vmlens.api as test dependency.
plugins {
  id "com.vmlens.interleave" version "1.1.5"
}
repositories {
    jcenter()
}
dependencies {
    testImplementation('com.vmlens:api:1.1.5' )
}
Now you can run the tests using the task interleave, e.g.:gradle interleave
The vmlens interleave task is based on the gradle test task. All configs which apply to the test task apply also to the interleave task, except the test fork configs.
The following parameters are additions from the vmlens interleave task:
The doNotTrace let you exclude methods from tracing through vmlens. A method matching the doNotTrace tag and all methods called by this method will not be traced by vmlens. In the following example the method om. and all methods of the class com. will not be traced:
interleave {
    doNotTraceIn 'com.vmlens.test.TestMethod.signal'
    doNotTraceIn 'com.vmlens.test.TestMavenDoNotTrace.*'
}
vmlens supports the ant directory pattern for method names. So you can use the following wild cards:
Examples:
The suppress tag let you suppress data races. If a data race is suppressed it will no longer show in the issue report and the build will no longer fail because of this data race. The following example shows how to suppress a data race at the field com., at the primitive array int[] in the method com. and at the array java.lang.String[] in the class com. using the pattern *.
interleave {
    suppress 'com.vmlens.examples.config.TestSuppressDataRaceAtField.i'
    suppress 'int[]@com.vmlens.examples.config.TestSuppressPrimitiveArrayWithAt.updateArray'
    suppress 'java.lang.String[]@com.vmlens.examples.config.TestSuppressArrayWithAtAndPattern.*'
}
Trace let you narrow the methods which get traced. If trace is configured vmlens will only search for data races inside methods matching the trace elements. Also when showing the stack trace where the data race was found vmlens will start at the first method matching a trace element.
The following example shows how to narrow the search and stack trace to methods from classes to the package com.vmlens.test.
interleave {
    onlyTraceIn 'com.vmlens.test.state.report.**'
}
vmlens supports the ant directory pattern for method names. So you can use the following wild cards:
Examples:
Setting deadlockAndDataRaceDetection to false let you disable the offline detection of deadlocks and data races.
interleave {
    deadlockAndDataRaceDetection false
}
The issues report shows you all the issues found by vmlens. vmlens detects data races and deadlock by analyzing the execution trace of your test. The report is located in the file build/reports/tests/interleave/issues.html.

The example report shows one data race, the symbol  and one deadlock, the symbol
  . The data races happened at accessing the field example.TestDataRace.i .The deadlock happened between the method lockOneToLockTwo and lockTwoToLockOne. Click one of the links to see the stack traces of the data race or deadlock.
After clicking on the data race you see the following report:

This Html site shows you the stack trace and thread name of the reading thread, the symbol  and for the writing thread, the symbol
  .
.
After clicking on the deadlock you see the following report:

This report shows you the thread names of the two threads in the deadlock, the symbol  ,and the stack trace. The position in the stack trace in which a monitor was acquired is marked with the symbol
  .
.
The interleave report shows you the thread interleavings which led to an assertion error or to a data race. The report is located in the file build/reports/tests/interleave/elements.html.


The interleave detail report shows you one thread interleaving of an interleave loop. The report shows you all synchronization actions and data races in the order of occurrence. In the above example, first, a thread with thread id 13 wrote to the variable i which led to data race. After that, the same thread entered a synchronized block, and so on. The following symbols are used in this report:
The following symbols are used in this report:
 A write which led to a data race
 A read which led to a data race
 A write to a volatile field
 A read to a volatile field
 A monitor or lock enter
 A monitor or lock exit
The stack trace report shows the stack trace of a method call:

Install from marketplace:
Or install directly from update site:
To use the class AllInterleavings you need to include the jar api-1.1.5.jar into your classpath. You can download this jar from maven central here.
To run a unit test use the junit vmlens shortcut:

The vmlens configuration for JUnit runs is described here
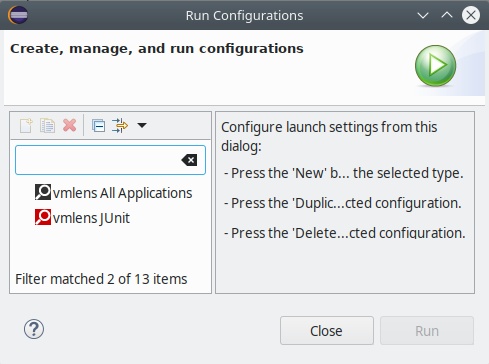
To run vmlens with another type of application, create a "vmlens All Applications" run configuration. Select Run -> Run Configurations... from the main menu. And create a "vmlens All Applications" run configuration:
After pressing run vmlens shows you the following dialog:
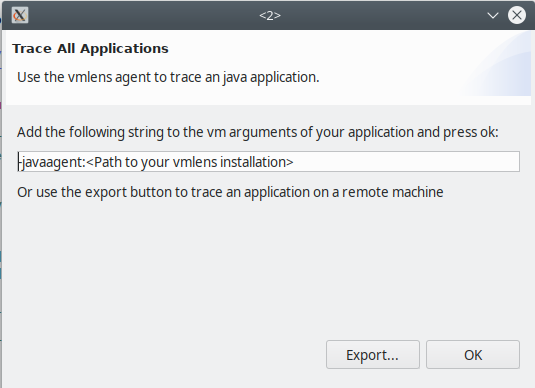
To run vmlens with an application on your local machine either inside or outside of eclipse add the vmlens agent string to the VM arguments of your application. To run on a remote machine export the agent files to a folder by pressing the export button.
Copy this folder to your remote machine and configure your application with an agent string pointing to the agent.jar in this folder:
-javaagent:<Path of agent.jar>/agent.jar
When you start your application the vmlens agent creates a folder vmlens in the working directory of your application. After you stopped your application the agent stops and you can import the folder vmlens in eclipse: Select File -> Import... from the main menu and select the vmlens Agent files wizard as shown below:

Now vmlens will analyze the execution trace of your application and open the vmlens perspective in eclipse showing you the results.
Please set the java heap size for eclipse in the eclipse.ini to a high enough value, for example -Xmx5g
In the default configuration, the agent writes the execution trace in a folder called vmlens in the working directory of your application. To change this path, change the property eventDir in the file called run.properties in the folder which contains the agent.jar file. In the default configuration, this property is set to ./vmlens/
eventDir=./vmlens/
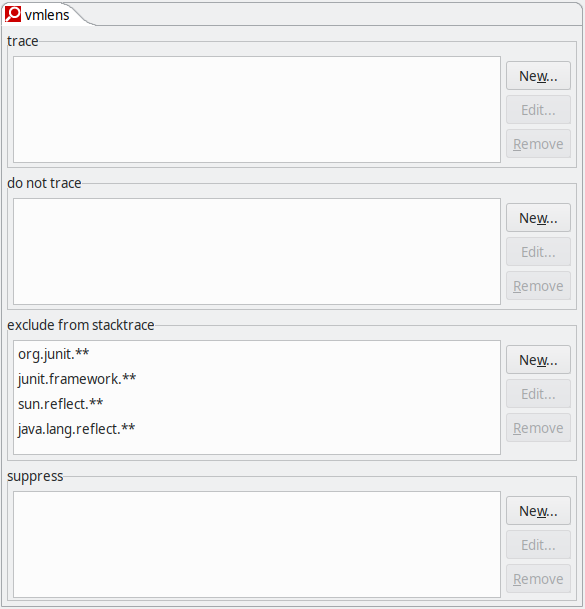
In the run configuration you can configure the following properties:
Trace let you narrow the methods which get traced. If trace is configured vmlens will only search for data races inside methods matching the trace elements. Also when showing the stack trace where the data race was found vmlens will start at the first method matching a trace element.
vmlens does not trace when inside a method which matches a pattern in this list.
Methods matching the given pattern will not be shown in stack traces, for example in the stack trace for a deadlock or data race.
A data race name matching this pattern, will not be shown in the issue view.
vmlens supports the ant directory pattern for method names. So you can use the following wild cards:
Examples:
The issue report shows you all data races and deadlocks. Open the view you by going to Window -> Show View -> Other... -> vmlens -> vmlens Issues.
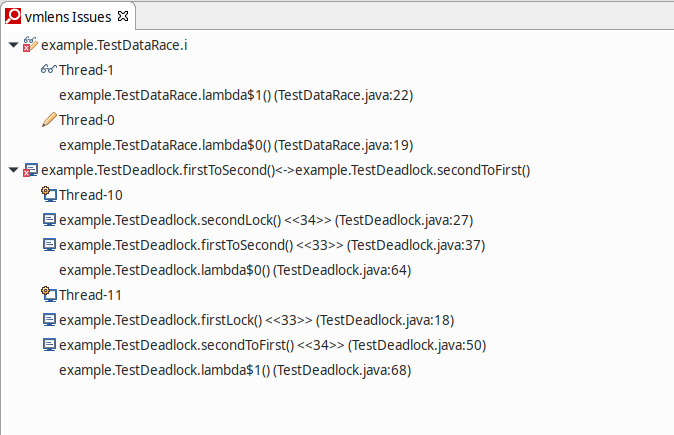
The example report shows one data race, the symbol  and one deadlock, the symbol
  .
.
For the data race the view shows you the stack trace and thread name of the reading thread, the symbol  and for the writing thread, the symbol
  .
.
For the deadlock the view shows you the thread names of the two threads in the deadlock, the symbol  ,and the stack trace. The position in the stack trace in which a monitor was acquired is marked with the symbol
  .
.
The interleave report shows you the thread interleavings which led to an assertion error or to a data race. Open the view you by going to Window -> Show View -> Other... -> vmlens -> vmlens Explorer.

The above example report shows you the three potential outcomes of the interleave loop:


 .
.By clicking on the successful interleave loop you see the last thread interleaving of this loop. By clicking on the interrupted loop you see the thread interleaving which led to the interrupt. And by clicking on the loop with a data race you see the thread interleaving which led to the data race.

The interleave detail report shows you one thread interleaving of an interleave loop. The report shows you all synchronization actions and data races in the order of occurrence. In the above example, first, a thread with thread id 13 wrote to the variable i which led to data race. After that, the same thread entered a synchronized block, and so on. The following symbols are used in this report:
The following symbols are used in this report:
 A write which led to a data race
 A read which led to a data race
 A write to a volatile field
 A read to a volatile field
 A monitor or lock enter
 A monitor or lock exit
The stack trace report shows the stack trace of a method call:

vmlens provides one class and one annotation to define the behavior of vmlens. You can download those classes from maven central or using the following dependency in your maven pom:
<dependency>
  <groupId>com.vmlens</groupId>
  <artifactId>api</artifactId>
  <version>1.1.5</version>
</dependency>
The JavaDoc is available here.
The class com.vmlens.api.AllInterleavings let you test all thread interleavings for your test. Enclose your test in a while loop to iterate through all thread interleavings like in the following example:
import com.vmlens.api.AllInterleavings;
public class TestUniqueId {
 long firstId;
 long secondId;
 @Test
 public void testUniqueId() throws InterruptedException {
  try (AllInterleavings allInterleavings =
    new AllInterleavings("ConcurrencyTestUniqueId");) {
    while (allInterleavings.hasNext()) {
		firstId  = 0L;
		secondId = 0L;
		UniqueId uniqueId = new UniqueId();
		Thread first = new Thread(() -> {
			firstId = uniqueId.nextId();
		});
		first.start();
		secondId = uniqueId.nextId();
		first.join();
		assertTrue(firstId != secondId);
    }
  }
 }
}
The com.vmlens.annotation.DoNotTrace annotation lets you define methods that should not be traced by vmlens. This allows you to enforce a specific ordering of your thread without influencing the data race detection of vmlens. In the following example, the CountDownLatch creates a happens-before relation between the i++ in the methods updateBefore and updateAfter:
import com.vmlens.annotation.DoNotTrace;
public class UpdateWithDoNotTrace {
	private int i = 0;
	final	CountDownLatch countDownLatch =
		new CountDownLatch(1);
	@DoNotTrace
	private void signal() {
		countDownLatch.countDown();
	}
	@DoNotTrace
	private void wait4Signal()
			throws InterruptedException {
		countDownLatch.await();
	}
	public void updateBefore() {
		i++;
		signal();
	}
	public void updateAfter()
			throws InterruptedException {
		wait4Signal();
		i++;
	}
}
So without DoNotTrace vmlens would not flag this as a data race. With DoNotTrace detects a data race when the two methods are run in parallel.
This error happens when a thread executes more than the configured maximum of synchronization actions. This typical happens when the test contains a not terminating loop.
You can set the maximum by using the method maximumSynchronizationActionsPerThread of the class AllInterleavingsBuilder. In the following example the value is set to 1000:
try (AllInterleavings testUpdate = AllInterleavings.
builder("TestShowSharedMemory").
maximumSynchronizationActionsPerThread(1000).
build();) {
while( testUpdate.hasNext() ) {
}
}
The default value is 2000. Set the maximum to -1 to never terminate a thread with this mechanism.
© 2020 vmlens Legal Notice Privacy Policy